Ever-increasing demand for transport services has given rise to various challenges such as congestion, energy and environmental problems, and safety and security issues. However, advancements in sensing and information technology for road transport performance measurement, such as wireless sensors and Automatic Vehicle Identification AVI, have recently begun to contribute to sustainable development and management of urban transport systems.
Road congestion is a significant problem in the UK. The Eddington study, a government commissioned report aiming to examine the long-term links between transport and the UK’s economic productivity, growth and stability, projected that the monetary cost of congestion will reach £22b per year for all road users by 2025. A massive 13% of road traffic will be subject to stop-start travel conditions. In a report published in 2009, UK Department for Transport also suggests that congestion across the English road network as a whole will increase by 27% between 2003 to 2025, and 54% by 2035. Construction of new infrastructure is unlikely to be a sustainable solution due to increasingly tight fiscal, physical and environmental constraints. Consequently, governments, businesses, and research teams around the world are exploring alternative ways to effectively utilize and manage existing road infrastructure.
Construction of new infrastructure is unlikely to be a sustainable solution [to increasing road congestion] due to increasingly tight fiscal, physical and environmental constraints
Traffic Tools
As the old adage goes “you can’t manage what you don’t measure”. In a modern age, detailed and reliable traffic data are a prerequisite for effective transport management1. However, urban traffic data varies greatly in terms of collection method and reliability. Traditionally traffic data in urban environments are collected through various fixed location sensors such as loop detectors and automatic traffic counters, which provide information of traffic volume, composition of traffic, concentration and speed. Nevertheless, fixed sensors are expensive to install, operate and maintain. Installation of a loop detector requires extensive lane closures as well as significant saw-cut- ting of the roadway surface which is costly.
The 21st century is an era of information and communication technology. With costs decreasing, and increasing power and market share, various new sensing and communication devices such as wireless sensors, GPS and Automatic Vehicle Identification (AVI) techniques are cost-effective substitutes for traditional and expensive loop detectors.
Journey times are amongst the most important performance indicators for urban transport networks. As an example, journey times in London are derived via an Automatic Number Plate Recognition (ANPR) technique. In London, there are around 500 cameras enforcing various policies such as congestion charging and low emission zones. Hence, journey times and car speed between two ANPR camera sites can be estimated by matching the license plate numbers. For example, there is a 1km stretch of Waterloo Road in Central London with a pair of ANPR cameras installed at both ends. Errors may arise in matching the license plate numbers due to various reasons such as misreading of license plates, vehicles taking unusually long route between the two camera locations, data loss due to road closure, or failure of hardware systems.
Consequently, a set of data filtering and processing rules has been adopted to improve the journey time estimation2, which is supplemented by patching or imputation algorithms that estimate missing data. In London, this type of analysis is done by the London Congestion Analysis Project (LCAP). However, a major weakness with the ANPR journey times is that they do not capture many spatial features of traffic flow. This is because the distance between any pair of ANPR camera sites is typically in the range of kilometres, meaning they miss a lot of spatial variation among urban streets. To extract more detailed spatial information, it is possible to use GPS–equipped car data provided by a traffic information provider called Trafficmaster. For vehicles on the road equipped with the GPS devices, detailed information about position and speed can be recorded at short time- intervals. However, there are only a very limited number of Trafficmaster vehicles on the road (about 1,500 such vehicles in the Greater London Area). With such a small sample size, Trafficmaster can only reveal limited temporal characteristics of traffic.
Successful avoidance of paralysing traffic congestion [during the London Olympics] was due to a range of management policies operated by the London transport authorities that include active traffic management, provision of alternative modes (e.g. subway), and restrictions on roadworks
Our team at UCL have developed an algorithm to integrate these two kinds of traffic data. The objective is to reconstruct urban traffic flows through processing and integrating data from different sources. This fusion algorithm is able to retrieve hidden features of traffic flow that are not observable by ANPR or GPS data alone. Estimated journey times can then be used to derive various performance metrics such as speeds, travel reliability, and impact of major events such as strikes3 and the Olympics4. This enables transport engineers to calculate the benefits and costs associated with different policies or control plans in order to improve the day-to-day operations.
Olympian Speeds
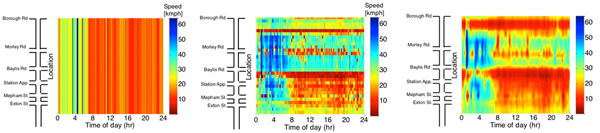
For example, during the 2012 Olympics, traffic gridlock was anticipated by many Londoners and visitors alike. We can compare both weekday and weekend congestions patterns during this period in 2011 and 2012:
- There is a clear speed drop during 06:00-20:00 due to traffic of commuters’ or other commercial activities.
- Speed profiles show less variation during week- end although the congestion charge is not in operation.
- Traffic was actually travelling faster during the Olympics period.
Successful avoidance of paralysing traffic congestion was due to a range of management policies operated by the London transport authorities that include active traffic management, provision of alternative modes (e.g. subway), and restrictions on roadworks. Empirical studies on the Oyster card system also noted a significant change in travel behaviour that led to the improvement of road network performance during the Olympics period4.
Smart Sensors
Recent innovation in the collection and analysis of new data such as trajectories data derived from mobile sensors like GPS, Bluetooth devices, smart cards (e.g. Oyster) and even smart phones has enabled researchers to develop new solutions to congestion management. With decreasing costs and increasing penetration, mobile sensors are now a potentially viable substitute to conventional fixed sensors, given their high sampling rate and high spatial coverage. More importantly, these sensors already exist and are used by travellers. In London, GPS transponders have been installed on all London buses, police vehicles and most taxis. Smart-phone data can monitor, for example, pedestrians. Oyster cards facilitate observation of flows on public transport (buses tubes, trains, ferries), and the Barclays Cycle Scheme records usage levels at bike stations on a real- time basis with their GPS installation.
Considering the importance of transport systems to both economic and social development, the creation of tools to analyse and manage transport systems will be particularly beneficial to developing countries. For example, in Indonesia and Kenya, transport authorities must rely heavily on manual traffic counting and control on major roads due to a lack of resources and budget for installing fixed sensing infrastructure. Applications of innovative mobile sensing and communication technology can help these countries to improve the efficiency, reliability and security of their transport infrastructure at a reduced cost.
The author would like to acknowledge Transport for London for providing relevant data for analysis. The contents of this report reflect the views of the author and do not reflect the official views or policies of Transport for London and other organizations. This article also does not constitute a standard, specification, or regulation.